Intervals, Thresholds, and Long Slow Distance: the Role of Intensity and Duration in Endurance Training Stephen Seiler1 and Espen Tønnessen2 Sportscience 13, 32-53, 2009 (sportsci.org/2009/ss.htm) |
|
Interval Training: a Long History Training
Plans and Cellular Signaling Training Intensities
of Elite Endurance Athletes Training
Volume of Elite Athletes Intensity
for Recreational Athletes Case
Studies of Training Manipulation Case 1–From
Soccer Pro to Elite Cyclist Case
2–From Modern Pentathlete to Runner Valid
Comparisons of Training Interventions The evening before the start of the 2009 European College of Sport Science Congress in Oslo, the two of us were sitting at a doctoral dissertation defense dinner that is part of the time honored tradition of the “doctoral disputas” in Scandinavia. One of us was the relieved disputant (Tønnessen) who had successfully defended his dissertation. The other had played the adversarial role of “førsteopponent.” Tønnessen’s research on the talent development process included extensive empirical analyses of the training characteristics of selected world champion female endurance athletes. His career case-study series systematized training diary logs of over 15,000 training sessions from three World and/or Olympic champions in three sports: distance running, cross-country skiing, and orienteering. Common for all three champions was that over their long, successful careers, about 85 % of their training sessions were performed as continuous efforts at low to moderate intensity (blood lactate £2 mM). Among the 40 guests sat coaches, scientists, and former athletes who had been directly or indirectly involved in winning more endurance sport Olympic gold medals and world championships than we could count. One guest, Dag Kaas, had coached 12 individual world champions in four different sports. In his toast to the candidate he remarked, ”My experience as a coach tells me that to become world champion in endurance disciplines, you have to train SMART, AND you have to train a LOT. One without the other is insufficient.” So what is smart endurance training? The question is timely: research and popular interest in interval training for fitness, rehabilitation, and performance has skyrocketed in recent years on the back of new research studies and even more marketing by various players in the health and fitness industry. Some recent investigations on untrained or moderately trained subjects have suggested that 2-8 wk of 2-3 times weekly intense interval training can induce rapid and substantial metabolic and cardiovascular performance improvements (Daussin et al., 2007; Helgerud et al., 2007; Talanian et al., 2007). Some popular media articles have interpreted these findings to mean that long, steady distance sessions are a waste of time. Whether well founded or not, this interpretation raises reasonable questions about the importance and quantity of high- (and low-) intensity training in the overall training process of the endurance athlete. Our goal with this article is to discuss this issue in a way that integrates research and practice. In view of the recent hype and the explosion in the number of studies investigating interval training in various health, rehabilitation, and performance settings, one could be forgiven for assuming that this training form was some magic training pill scientists had devised comparatively recently. The reality is that athletes have been using interval training for at least 60 years. So, some discussion of interval training research is in order before we address the broader question of training intensity distribution in competitive endurance athletes. Interval Training: a Long HistoryInternational running coach Peter Thompson wrote in Athletics Weekly that clear references to “repetition training” were seen already by the early 1900s (Thompson, 2005). Nobel Prize winning physiologist AV Hill incorporated intermittent exercise into his studies of exercising humans already in the 1920s (Hill et al., 1924a; Hill et al., 1924b). About this time, Swede Gosta Holmer introduced Fartlek to distance running (fart= speed and lek= play in Swedish). The specific term interval training is attributed to German coach Waldemer Gerschler. Influenced by work physiologist Hans Reindell in the late 1930s, he was convinced that alternating periods of hard work and recovery was an effective adaptive stimulus for the heart. They apparently adopted the term because they both believed that it was the recovery interval that was vital to the training effect. Since then, the terms intermittent exercise, repetition training, and interval training have all been used to describe a broad range of training prescriptions involving alternating work and rest periods (Daniels and Scardina, 1984). In the 1960s, Swedish physiologists, led by Per Åstrand, performed groundbreaking research demonstrating how manipulation of work duration and rest duration could dramatically impact physiological responses to intermittent exercise (Åstrand et al., 1960; Åstrand I, 1960; Christensen, 1960; Christensen et al., 1960). As Daniels and Scardina (1984) concluded 25 years ago, their work laid the foundation for all interval training research to follow. In their classic chapter Physical Training in Textbook of Work Physiology, Åstrand and Rodahl (1986) wrote, “it is an important but unsolved question which type of training is most effective: to maintain a level representing 90 % of the maximal oxygen uptake for 40 min, or to tax 100 % of the oxygen uptake capacity for about 16 min.” (The same chapter from the 4th edition, published in 2003, can be read here.) This quote serves as an appropriate background for defining high intensity aerobic interval training (HIT) as we will use it in this article: repeated bouts of exercise lasting ~1 to 8 min and eliciting an oxygen demand equal to ~90 to 100 % of VO2max, separated by rest periods of 1 to 5 min (Seiler and Sjursen, 2004; Seiler and Hetlelid, 2005). Controlled studies comparing the physiological and performance impact of continuous training (CT) below the lactate turnpoint (typically 60-75 % of VO2max for 30 min or more) and HIT began to emerge in the 1970s. Sample sizes were small and the results were mixed, with superior results for HIT (Henriksson and Reitman, 1976; Wenger and Macnab, 1975), superior results for CT (Saltin et al., 1976), and little difference (Cunningham et al., 1979; Eddy et al., 1977; Gregory, 1979). Like most published studies comparing the two types of training, the CT and HIT interventions compared in these studies were matched for total work (iso-energetic). In the context of how athletes actually train and perceive training stress, this situation is artificial, and one we will come back to later. McDougall and Sale (1981) published one of the earliest reviews comparing the effects of continuous and interval training, directed at coaches and athletes. They concluded that both forms of training were important, but for different reasons. Two physiological assumptions that are now largely disproven influenced their interpretation. First, they concluded that HIT was superior for inducing peripheral changes, because the higher work intensity induced a greater degree of skeletal muscle hypoxia. We now know that in healthy subjects, increased lactate accumulation in the blood during exercise need not be due to increased muscle hypoxia (Gladden, 2004). Second, they concluded that since stroke volume already plateaus at 40-50 %VO2max, higher exercise intensities would not enhance ventricular filling. We now know that stroke volume continues to rise at higher intensities, perhaps even to VO2max, in well trained athletes (Gledhill et al., 1994; Zhou et al., 2001). Assuming a stroke volume plateau at low exercise intensity, they concluded that the benefit of exercise on cardiac performance was derived via stimulation of high cardiac contractility, which they argued peaked at about 75 %VO2max. Thus, moderate-intensity continuous exercise over longer durations and therefore more heart beats was deemed most beneficial for enhancing cardiac performance. While newer research no longer supports their specific conclusions, they did raise the important point that there are underlying characteristics of the physiological response to HIT and CT that should help explain any differential impact on adaptive responses. Poole and Gaesser (1985) published a citation classic comparing 8 wk of 3 × weekly training of untrained subjects for either 55 min at 50 %VO2max, 35 min at 75 %VO2max, or 10 × 2 min at 105 %VO2max with 2-min recoveries. They observed no differences in the magnitude of the increase in either VO2max or power at lactate threshold among the three groups. Their findings were corroborated by Bhambini and Singh (1985) in a study of similar design published the same year. Gorostiaga et al. (1991) reported findings that challenged McDougall and Sale's conclusions regarding the adaptive specificity of interval and continuous training. They had untrained subjects exercise for 30 min, three days a week either as CT at 50 % of the lowest power eliciting VO2max, or as HIT, alternating 30 s at 100 % of power at VO2max and 30 s rest, such that total work was matched. Directly counter to McDougall and Sales conclusions, they found HIT to induce greater changes in VO2max, while CT was more effective in improving peripheral oxidative capacity and the lactate profile. At the beginning of the 1990s, the available data did not support a consensus regarding the relative efficacy of CT vs HIT in inducing peripheral or central changes related to endurance performance. Twenty years on, research continues regarding the extent to which VO2max, fractional utilization of VO2max, and work efficiency/economy are differentially impacted by CT and HIT in healthy, initially untrained individuals. Study results continue to be mixed, with some studies showing no differences in peripheral and central adaptations to CT vs HIT (Berger et al., 2006; Edge et al., 2006; Overend et al., 1992) and others greater improvements with HIT (Daussin et al., 2008a; Daussin et al., 2008b; Helgerud et al., 2007). When differences are seen, they lean in the direction that continuous work at sub-maximal intensities promotes greater peripheral adaptations and HIT promotes greater central adaptations (Helgerud et al., 2007). Controlled studies directly comparing CT and HIT in already well-trained subjects were essentially absent from the literature until recently. However, a few single-group design studies involving endurance athletes did emerge in the 1990s. Acevedo and Goldfarb (1989) reported improved 10-km performance and treadmill time to exhaustion at the same pace up a 2 % grade in well-trained runners who increased their training intensity to 90-95 %VO2max on three of their weekly training days. In these already well-trained athletes, VO2max was unchanged after 8 wk of training intensification, but a right shift in the blood lactate profile was observed. In 1996 -97, South African sport scientists published the results of a single group intervention involving competitive cyclists (Lindsay et al., 1996; Weston et al., 1997). They trained regionally competitive cyclists who were specifically selected for study based on the criteria that they had not undertaken any interval training in the 3-4 months prior to study initiation. When 15 % of their normal training volume was replaced with 2 d.wk-1 interval training for 3-4 wk (six training sessions of six 5-min high intensity work bouts), 40-km time trial performance, peak sustained power output (PPO), and time to fatigue at 150 %PPO were all modestly improved. Physiological measurements such as VO2max and lactate profile changes were not reported. Stepto and colleagues then addressed the question of interval-training optimization in a similar sample of non-interval trained, regional cyclists (Stepto et al., 1999). They compared interval bouts ranging from 80 to 175 % of peak aerobic power (30 s to 8 min duration, 6-32 min total work). Group sizes were small (n=3-4), but the one group that consistently improved endurance test performance (~3 %) had used 4-min intervals at 85 % PPO. These controlled training intensification studies essentially confirmed what athletes and coaches seemed to have known for decades: some high-intensity interval training should be integrated into the training program for optimal performance gains. These studies also seemed to trigger a surge in interest in the role of HIT in athlete performance development that has further grown in recent years. If doing
some HIT (1-2 bouts per week) gives a performance boost, is more even better?
Billat and colleagues explored this question in a group of middle distance
runners initially training six sessions per week of CT only. They found that
a training intensification to four CT sessions, one HIT session, and one
lactate threshold (LT) session resulted in improved running speed at VO2max (but not VO2max
itself) and running economy. Further intensification to two CT sessions,
three HIT sessions and one LT session each week gave no additional adaptive
benefit, but did increase subjective training stress and indicators of
impending overtraining (Billat et al., 1999). In
fact, training intensification over periods of 2-8 wk with frequent
high-intensity bouts (3-4 sessions per week) is an effective means of
temporarily compromising performance and inducing overreaching and possibly
overtraining symptoms in athletes (Halson and Jeukendrup, 2004). There is likely an appropriate balance between
high- and low-intensity training in the day-to-day intensity distribution of
the endurance athlete. These findings bring us to two related questions: how
do really good endurance athletes actually train, and is there an optimal
training intensity distribution for long-term performance development? While arguments can be made that tradition, resistance to change and even superstition may negatively influence training methods of elite endurance athletes, sports history tells us that athletes are experimental and innovative. Observing the training methods of the world's best endurance athletes represent a more valid picture of “best practice” than we can develop from short-term laboratory studies of untrained or moderately trained subjects. In today’s performance environment, where promising athletes have essentially unlimited time to train, all athletes train a lot and are highly motivated to optimize the training process. Training ideas that sound good but don't work in practice will fade away. Given these conditions, we argue that any consistent pattern of training intensity distribution emerging across sport disciplines is likely to be a result of a successful self-organization (evolution) towards a “population optimum.” High performance training is an individualized process for sure, but by population optimum, we mean an approach to training organization that results in most athletes staying healthy, making good progress, and performing well in their most important events. Exercise Intensity ZonesTo describe intensity distribution in endurance athletes we have to first agree on an intensity scale. There are different intensity zone schemes to choose from. Most national sport governing bodies employ an intensity scale based on ranges of heart rate relative to maximum and associated typical blood lactate concentration range. Research approaches vary, but a number of recent research studies have identified intensity zones based on ventilatory thresholds. Here we will examine an example of each of these scales. Table 1 shows the intensity scale used by all endurance sports in Norway. A valid criticism of such a scale is that it does not account for individual variation in the relationship between heart rate and blood lactate, or activity specific variation, such as the tendency for maximal steady state concentrations for blood lactate to be higher in activities activating less muscle mass (Beneke and von Duvillard, 1996; Beneke et al., 2001).
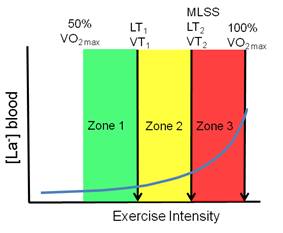
Several recent studies examining training intensity distribution (Esteve-Lanao et al., 2005; Seiler and Kjerland, 2006; Zapico et al., 2007) or performance intensity distribution in multi-day events (Lucia et al., 1999; Lucia et al., 2003) have employed the first and second ventilatory turnpoints to demarcate three intensity zones (Figure 1). The 5-zone scale in the table above and the 3-zone scale below are reasonably super-imposable in that intensity Zone 3 in the 5-zone system coincides well with Zone 2 in the 3-zone model. While defining five “aerobic” intensity zones is likely to be informative in training practice, it is important to note that they are not based on clearly defined physiological markers. Note also that 2-3 additional zones are typically defined to accommodate very high intensity sprint, anaerobic capacity, and strength training. These zones are typically defined as “anaerobic” Zones 6, 7, and 8.
Training Plans and Cellular SignalingAthletes do not train at the same intensity or for the same duration every day. These variables are manipulated from day to day with the implicit goals to maximize physiological capacity over time, and stay healthy. Indeed, the former is quite dependent on the latter. Training frequency is also a critical variable manipulated by the athlete. This is particularly evident when comparing younger (often training 5-8 times per week) and more mature athletes at peak performance level (often training 10-13 sessions per week). Ramping up training frequency (as opposed to training longer durations each session) is responsible for most of the increase in yearly training hours observed as teenage athletes mature. Cycling might be an exception to this general rule, since cycling tradition dictates single daily sessions that often span 4-6 h among professionals. The ultimate targets of the training process are individual cells. Changes in rates of DNA transcription, RNA translation, and ultimately, synthesis of specific proteins or protein constellations are induced via a cascade of intracellular signals induced by the training bout. Molecular exercise biologists are unraveling how manipulation of intensity and duration of exercise specifically modifies intracellular signaling and resulting protein synthetic rates at the cellular or whole muscle/myocardial level (Ahmetov and Rogozkin, 2009; Hoppeler et al., 2007; Joseph et al., 2006; Marcuello et al., 2005; McPhee et al., 2009; Yan, 2009). About 85 % of all publications involving gene expression and exercise are less than 10 y old, so we do not yet know enough to relate results of Western blots to the specific training of an athlete. The signaling impact of a given exercise stress (intensity×duration) almost certainly decays with training (Hoppeler et al., 2007; Nordsborg et al., 2003). For example, AMP activated protein kinase α2 (AMPK) activity jumps 9-fold above resting levels after 120 min of cycling at 66 %VO2max in untrained subjects. However, after only 10 training sessions, almost no increase in AMPK is seen after the same exercise bout (McConell et al., 2005). Manipulating exercise intensity and duration also impacts the systemic stress responses associated with training. Making this connection is further complicated by recent findings suggesting that muscle glycogen depletion can enhance and antioxidant supplementation can inhibit adaptations to training (Brigelius-Flohe, 2009; Gomez-Cabrera et al., 2008; Hansen et al., 2005; Ristow et al., 2009; Yeo et al., 2008). It seems fair to conclude that while we suspect important differences exist, we are not yet able to relate specific training variables (e.g., 60 min vs 120 min at 70 %VO2max) to differences in cell signaling in a detailed way. Our view of the adaptive process remains limited to a larger scale. We can still identify some potential signaling factors that are associated with increased exercise intensity over a given duration (Table 2) or increased exercise duration at a given sub-maximal intensity (Table 3). Some of these are potentially adaptive and others maladaptive. There is likely substantial overlapping of effects between extending exercise duration and increasing exercise intensity. It may be a hard pill to swallow for some exercise physiologists, but athletes and coaches do not need to know very much exercise physiology to train effectively. They do have to be sensitive to how training manipulations impact athlete health, daily training tolerance, and performance, and to make effective adjustments. Over time, a successful athlete will presumably organize their training in a way that maximizes adaptive benefit for a given perceived stress load. That is, we can assume that highly successful athletes integrate this feedback experience over time to maximize training benefit and minimize risk of negative outcomes such as illness, injury, stagnation, or overtraining.
Training Intensities of Elite Endurance AthletesEmpirical descriptions of the actual distribution of training intensity in well-trained athletes have only recently emerged in the literature. The first time one of us (Seiler) gave a lecture on the topic was in 1999, and there were few hard data to present, but a fair share of anecdote and informed surmise. Carl Foster, Jack Daniels and Seiler published a book chapter the same year, “Perspectives on Correct Approaches to Training” that synthesized what we knew then (read chapter here via Google books). At that time, much of the discussion and research related to the endurance training process focused on factors associated with overtraining (a training control disaster), with little focus on what characterized “successful training.” The empirical foundation for describing successful training intensity distribution is stronger 10 years later. Robinson et al. (1991) published what was according to the authors “the first attempt to quantify training intensity by use of objective, longitudinal training data.” They studied training characteristics of 13 national class male, New Zealand runners with favorite distances ranging from 1500 m to the marathon. They used heart rate data collected during training and related it to results from standardized treadmill determinations of heart rate and running speed at 4-mM blood lactate concentration (misnamed anaerobic threshold at the time). Over a data collection period of 6-8 wk corresponding to the preparation phase, these athletes reported that only 4 % of all training sessions were interval workouts or races. For the remaining training sessions, average heart rate was only 77 % of their heart rate at 4-mM blood lactate. This heart rate translates to perhaps 60-65 % of VO2max. The authors concluded that while their physiological test results were similar to previous studies of well trained runners, the training intensity of these runners was perhaps lower than optimal, based on prevailing recommendations to perform most training at or around the lactate/anaerobic threshold. In one of the first rigorous quantifications of training intensity distribution reported, Mujika et al. (1995) quantified the training intensity distribution of national and international class swimmers over an entire season based on five blood-lactate concentration zones. Despite specializing in 100-m and 200-m events requiring ~60 to 120 s, these athletes swam 77 % of the 1150 km completed during a season at an intensity below 2 mM lactate. The intensity distribution of 400- and 1500-m swim specialists was not reported, but was likely even more weighted towards high-volume, low-intensity swimming. Billat et al. (2001) performed physiological testing and collected data from training diaries of French and Portuguese marathoners. They classified training intensity in terms of three speeds: marathon, 10–km, and 3–km. During the 12 wk preceding an Olympic trials marathon, the athletes in this study ran 78 % of their training kilometers at below marathon speed, only 4 % at marathon race speed (likely to be near VT1), and 18 % at 10–km or 3–km speed (likely to be > VT2). This distribution of training intensity was identical in high-level (<2 h 16 min for males and <2 h 38 min for females) and top-class athletes (<2 h 11 min and <2 h 32 min). But the top-class athletes ran more total kilometers and proportionally more distance at or above 10–km speed. Kenyan runners are often mythologized for the high intensity of their training. It is therefore interesting that using the data from another descriptive study by Billat et al. (2003), we calculated that elite male and female Kenyan 5- and 10-km runners ran ~85 % of their weekly training kilometers below lactate-threshold speed. The first study on runners to quantify training intensity using three intensity zones was that of Esteve-Lanao et al. (2005). They followed the training of eight regional- and national-class Spanish distance runners over a six-month period broken into eight, 3-wk mesocycles. Heart rate was measured for every training session to calculate the time spent in each heart-rate zone defined by treadmill testing. All told, they quantified over 1000 heart-rate recordings. On average these athletes ran 70 km.wk-1 during the six-month period, with 71 % of running time in Zone 1, 21 % in Zone 2, and 8 % in Zone 3. Mean training intensity was 64 %VO2max. They also reported that performance times in both long and short races were highly negatively correlated with total training time in Zone 1. They found no significant correlation between the amount of high-intensity training and race performance. Rowers compete over a 2000-m distance requiring 6-7 min. Steinacker et al. (1998) reported that extensive endurance training (60- to 120-min sessions at <2 mM blood lactate) dominated the training volume of German, Danish, Dutch, and Norwegian elite rowers. Rowing at higher intensities was performed ~4-10 % of the total rowed time. The data also suggested that German rowers preparing for the world championships performed essentially no rowing at threshold intensity, but instead trained either below 2 mM blood lactate or at intensities in the 6-12 mM range. Seiler collaborated with long time national team rower, coach, and talent development coordinator Åke Fiskerstrand to examine historical developments in training organization among international medal winning rowers from Norway (Fiskerstrand and Seiler, 2004). Using questionnaire data, athlete training diaries, and physiological testing records, they quantified training intensity distribution in 27 athletes who had won world or Olympic medals in the 1970s to 1990s. They documented that over the three decades: training volume had increased about 20 % and become more dominated by low-intensity volume; the monthly hours of high-intensity training had dropped by one-third; very high intensity overspeed sprint training had declined dramatically in favor of longer interval training at 85-95 %VO2max; and the number of altitude camps attended by the athletes increased dramatically. Over this 30-y timeline, VO2max and rowing ergometer performance improved by ~10 % with no change in average height or body mass. Most of the changes occurred between the 1970s and 1980s, coinciding with major adjustments in training intensity. Most recently, Gullich et al. (2009) described the training of world class junior rowers from Germany during a 37-wk period culminating in national championships and qualification races for the world championships (online ahead of print here). These were very talented junior rowers, with 27 of 36 athletes winning medals in the junior world championships that followed the study period. Remarkably, 95 % of their rowing training was performed below 2 mM blood lactate, based on daily heart-rate monitoring and rowing ergometer threshold determinations performed at the beginning of the season. This heavy dominance of extensive endurance training persisted across mesocycles. However, the relatively small volume of Zone 2 and Zone 3 work shifted towards higher intensities from the basic preparation phase to the competition phase. That is, the intensity distribution became more polarized. It is important to point out that time-in-zone allocation based on heart-rate cut-offs (the kind of analysis performed by software from heart watch manufacturers) underestimates the time spent performing high-intensity exercise and the impact of that work on the stress load of an exercise session (Seiler and Kjerland, 2006). Although the outcomes are biased by this problem, there was still a clear shift in the intensity distribution towards large volumes of low- to moderate-intensity training. We also evaluated retrospectively whether there were any differences in junior training characteristics between a subgroup of rowers who went on to win international medals as seniors within three years (14 of 36 athletes) and the remainder of the sample, who all continued competing at the national level. The only physical or training characteristic that distinguished the most successful rowers from their peers was a tendency to distribute their training in a more polarized fashion; that is, they performed significantly more rowing at very low aerobic intensities and at the highest intensities. We concluded that the greater polarization observed might have been due to better management of intensity (keeping hard training hard and easy training easy) among the most successful athletes. This polarization might protect against overstress. Professional road cyclists are known for performing very high training volumes, up to 35,000 km.y-1. Zapico and colleagues (2007) used the 3-intensity zone model to track training characteristics from November to June in a group of elite Spanish under-23 riders. In addition, physiological testing was performed at season start and at the end of the winter and spring mesocycles. There was an increase in total training volume and a four-fold increase in Zone 3 training between the winter and spring mesocycles (Figure 2), but there was no further improvement in power at VT1, VT2 or at VO2max between the end of the winter and spring mesocycles (Figure 3), despite the training intensification. Anecdotally, this finding is not unusual, despite the fact that athletes feel fitter. It may be that VT2 and VO2max determination using traditional methods can miss an important increase in the duration that can be maintained at the associated workloads.
Individual and team pursuit athletes in cycling compete over about 4 min. The event appeals to sport scientists because the performance situation is highly controlled and amenable to accurate modeling of the variables on both sides of the power balance equation. Schumacher and Mueller (2002) demonstrated the validity of this approach in predicting “gold medal standards” for physiological testing and power output in track cycling. However, less obvious from the title was the detailed description of the training program followed by the German cyclists monitored in the study, ultimately earning a gold medal in Sydney in world-record time. These athletes trained to maintain 670 W in the lead position and ~450 W when following using a training program dominated by continuous low to moderate intensity cycling on the roads (29-35,000 km.y-1). In the 200 d preceding the Olympics, the athletes performed “low-intensity, high-mileage” training at 50-60 % of VO2max on ~140 d. Stage races took up another ~40 d. Specific track cycling at near competition intensities was performed on less than 20 d between March and September. In the ~110 d preceding the Olympic final, high-intensity interval track training was performed on only 6 d. Units for Training IntensityCross country skiers have rather legendary status in exercise physiology circles for their aerobic capacity and endurance capacity in arms and legs. Seiler et al. (2006) studied 12 competitive to nationally elite male 17–y old skiers from a special skiing high school in the region. The mean VO2max for the group was 72 ml.kg-1min-1. They were guided by coaches with national team coaching experience and were trained along similar lines to the seniors, but with substantially lower volumes of training. Like Esteve-Lanao (2005) did with runners, we used heart-rate monitoring to quantify all endurance sessions and determined three aerobic intensity zones based on ventilatory turn points. We also recorded the athletes' rating of perceived exertion (RPE) using the methods of Foster et al. (1996; 1998; 2001a) for all training bouts. Finally, we collected blood lactate during one training week to relate heart rate and perceived exertion measurements to blood lactate values. When comparing the three different intensity quantification methods, we addressed the issue of how training intensity is best quantified. Heart-rate monitoring is clearly appealing. We can save heart rate data, download entire workouts to analysis software, and quantify the time heart rate falls within specific pre-defined intensity zones. Using this “time-in-zone” approach, we found that 91 % of all training time was spent at a heart rate below VT1 intensity, ~6 % between VT1 and VT2, and only 2.6 % of all 15-s heart rate registrations were performed above VT2. We then quantified intensity by allocating each training session to one of the three zones based on the goal of the training and heart rate analysis. We called this the “session-goal approach”. For low-intensity continuous bouts, we used average heart rate for the entire bout. For bouts designed to be threshold training we averaged heart rate during the threshold-training periods. For high-intensity interval-training sessions, we based intensity on the average peak heart rate for each interval bout. Using this approach, intensity distribution derived from heart rate responses closely matched the session RPE (Figure 4), training diary distribution based on workout description, and blood-lactate measurements. The agreement between the session-by-session heart-rate quantification and session RPE-based assignment of intensity was 92 %. In their training diaries, athletes recorded 30-41 training sessions in 32 d and described 75% of their training bouts as low intensity continuous, 5% as threshold workouts, and 17% as intervals.
We have also recently observed the same time-in-zone mismatch when quantifying intensity distribution in soccer training (unpublished data). It seems clear that typical software-based heart-rate analysis methods overestimate the amount of time spent training at low intensity and underestimate the time spent at very high workloads compared to athlete perception of effort. We think this mismatch is important, because the unit of stress perceived and responded to by the athlete is the stress of the entire training session or perhaps training day, not minutes in any given heart-rate zone. The 80:20 Rule for IntensityIn spite of differences in the methods for quantifying training intensity, all of the above studies show remarkable consistency in the training distribution pattern selected by successful endurance athletes. About 80 % of training sessions are performed completely or predominantly at intensities under the first ventilatory turn point, or a blood-lactate concentration £2mM. The remaining ~20 % of sessions are distributed between training at or near the traditional lactate threshold (Zone 2), and training at intensities in the 90-100 %VO2max range, generally as interval training (Zone 3). An elite athlete training 10-12 times per week is therefore likely to dedicate 1-3 sessions weekly to training at intensities at or above the maximum lactate steady state. This rule of thumb coincides well with training studies demonstrating the efficacy of adding two interval sessions per week to a training program (Billat et al., 1999; Lindsay et al., 1996; Weston et al., 1997). Seiler and Kjerland (2006) have previously gone so far as say that the optimal intensity distribution approximated a “polarized distribution” with 75-80 % of training sessions in Zone 1, 5 % in Zone 2, and 15-20 % in Zone 3. However, there is considerable variation in how athletes competing in different sports and event durations distribute their training intensity within Zones 2 and 3. Why has this training pattern emerged? We do not have sufficient research to answer this question, but we can make some reasonable guesses. One group of factors would involve the potential for this distribution to best stimulate the constellation of training adaptations required for maximal endurance performance. For example, large volumes of training at low intensity might be optimal for maximizing peripheral adaptations, while relatively small volumes of high intensity training fulfill the need for optimizing signaling for enhanced cardiac function and buffer capacity. Technically, lots of low intensity training may be effective by allowing lots of repetitions to engrain correct motor patterns. On the other side of the adaptation-stress equation is the stress induced by training. Athletes may migrate towards a strategy where longer duration is substituted for higher intensity to reduce the stress reactions associated with training and facilitate rapid recovery from frequent training (Seiler et al., 2007). Interestingly, Foster and colleagues reported a very similar intensity distribution by professional cyclists during the 3 wk and 80+ racing hours of the grand tours, such as the Tour de France. Perhaps this distribution represents a form of pacing that emerges over the months of elite training (Foster et al., 2005). ”Low intensity”–between 50 %VO2max and just under the first lactate turnpoint–represents a wide intensity range in endurance athletes. There is probably considerable individual variation in where within this range athletes accumulate most of their low-intensity training volume. Technique considerations may play in: athletes have to train at a high enough intensity to allow correct technique. For example, Norwegian Olympic flat-water kayak gold medalist Eric Verås Larsen explained that the reason most of his Zone 1 continuous endurance training tended to be closer to his lactate threshold than normally observed was that he could not paddle with competition technique at lower intensities (Verås Larsen, personal communication). These qualifiers aside, we conclude that a large fraction of the training within this zone is being performed at ~60-65 %VO2max, We note that this intensity is about the intensity associated with maximal fat utilization in trained subjects (Achten and Jeukendrup, 2003), but it is unclear why optimizing fat utilization would be important for athletes competing over 3-15 min. Training Volume of Elite AthletesObviously, training intensity distribution and training volume together will determine the impact of training. Elite athletes train a lot, but to be more specific requires some common metric for comparing athletes in different sports. Runners and cyclists count kilometers, swimmers count thousands of meters, and rowers and cross-country skiers count training hours. With a few reasonable assumptions, we can convert these numbers to annual training hours. This physiological metric is appropriate, since the body is sensitive to stress duration. Training volume increases with age in high-level performers, mostly through increased training frequency in sports like running and cross-country skiing, but also through increases in average session duration, particularly in cycling. A talented teenage cyclist training five days a week might accumulate 10-15 h.wk-1. A professional cyclist from Italy performing a 1000-km training week will likely be on the bike between 25 and 30 h. Cycling 30-35,000 kilometers a year at, say, ~35 km.h-1 with occasional sessions of strength training, will add up to ~1000 h.y-1. An elite male marathoner would likely never run more than about 15 hours in a week. At an average running speed of 15 km.h-1, that would be at most 225 km. Former world record holder in the 5 km, 10 km, and marathon, Ingrid Kristiansen trained 550 h.y-1 when she was running (Espen Tønnessen, unpublished data). At a younger age, when she competed in the Olympics for Norway as a cross country skier, she actually trained 150 more h.y-1. Bente Skari, one of the most successful female cross country skiers ever, recorded peak annual training loads of 800 h.y-1 (Espen Tønnessen, unpublished data). Annual training volume measured in hours is around 1000 among world class rowers. For example, Olaf Tufte recorded 1100 training hours in 2004, when he took his first gold medal in the single scull event (Aasen, 2008). His monthly training volume for that year is shown in Figure 5. Of these hours, about 92 % were endurance training, with the remainder being primarily strength training. An Olympic champion swimmer like Michael Phelps may record even higher annual training volumes, perhaps as much as 1300 h (a reasonable guess based on training of other swimming medalists).
The Kenyan marathoner, Italian cyclist, Norwegian rower and American swimmer are all at the top of their sport, but when we measure their training volume in hours, they seem quite different, with international success being achieved with a two-fold or larger range in hours per year (Figure 6). What can explain this difference? One explanation is that the muscle, tendon, and joint loading stress of the different movements vary dramatically. Running imposes severe ballistic loading stress that is not present in cycling or swimming. There seems to be a strong inverse relationship between tolerated training volume and degree of eccentric or ballistic stress of the sport. Swimming, rowing, and cross-country skiing are all highly technical events with movement patterns that do not draw on the genetically pre-programmed motor pathways of running. Thus high volumes of training may be as important for technical mastery as for physiological adaptation in these disciplines. Rowers and speed skaters do less movement-specific training than most other athletes, but they accumulate substantial additional hours of strength training and other forms of endurance training.
Intensified-Training StudiesIs the “80:20” training intensity distribution observed for successful athletes really optimal, or would a redistribution of training intensity towards more threshold and high intensity interval training and less long slow distance training stimulate better gains and higher performance? Proponents of large volumes of interval training might invoke the famous pareto principle and propose that in keeping with this “rule” of effects vs causes, these athletes are achieving 80 % of their adaptive gains with 20 % of their training and wasting valuable training energy. In the last 10 y, several studies have been published addressing this question. Evertsen et al. (1997; 1999; 2001) published the first of three papers from a study involving training intensification in 20 well-trained junior cross-country skiers competing at the national or international level. All of the subjects had trained and competed regularly for 4-5 years. In the two months before study initiation, 84 % of training was carried out at 60-70 %VO2max, with the remainder at 80-90 %VO2max. They were then randomized to a moderate-intensity (MOD) or a high-intensity training group (HIGH). MOD maintained essentially the same training-intensity distribution they had used previously, but training volume was increased from 10 to 16 h.wk-1. HIGH reversed their baseline intensity distribution so that 83 % of training time was performed at 80-90 %VO2max, with only 17 % performed as low-intensity training. This group trained 12 h.wk-1. The training intervention lasted five months. Intensity control was achieved using heart-rate monitoring and blood-lactate sampling. Despite 60 % more training volume in MOD and perhaps 400 % more training at lactate threshold or above in HIGH, physiological and performance changes were modest in both groups of already well-trained athletes. Findings from the three papers are summarized in Table 4.
Gaskill et al. (1999) reported the results of a 2-y project involving 14 cross-country skiers training within the same club who were willing to have their training monitored and manipulated. The design was interesting and practically relevant. During the first year, athletes all trained similarly, averaging 660 training hours with 16 % at lactate threshold or higher (nominal distribution of sessions). Physiological test results and race performances during the first year were used to identify seven athletes who responded well to the training and seven who showed poor VO2max and lactate-threshold progression, and race results. In the second year, the positive responders continued using their established training program. The non-responders performed a markedly intensified training program with a slight reduction in training hours. The non-responders from Year 1 showed significant improvements with the intensified program in Year 2 (VO2max, lactate threshold, race points). The positive responders from Year 1 showed a similar development in Year 2 as in Year 1. It is interesting in this context to point out that many elite athletes now extend the periodization of their training to a 4-y Olympic cycle. The first year after an Olympics is a “recovery season”, followed by a building season, then a season of very high training volume, culminating with the Olympic season, where training volume is reduced and competition specificity is emphasized more. Variation in the pattern of training may be important for maximal development, but these large scale rhythms of training have not been studied. Esteve-Lanao et al. (2007) randomized 12 sub-elite distance runners to one of two training groups (Z1 and Z2) that were carefully monitored for five months. They based their training intensity distribution on the 3-zone model described earlier and determined from treadmill testing. Based on time-in-zone heart-rate monitoring, Z1 performed 81, 12, and 8 % of training in Zones 1, 2, and 3 respectively. Z2 performed more threshold training, with 67, 25, and 8 % of training performed in the three respective zones. That is, Group Z2 performed twice as much training at or near the lactate threshold. In a personal communication, the authors reported that in pilot efforts, they were unable to achieve a substantial increase in the total time spent in Zone 3, as it was too hard for the athletes. Total training load was matched between the groups. Improvement in a cross-country time-trial performed before and after the five-month period revealed that the group that had performed more Zone 1 training showed significantly greater race time improvement (-157 ± 13 vs ‑122 ± 7 s). Most recently, Ingham et al. (2008) were able to randomize 18 experienced national standard male rowers from the UK into one of two training groups that were initially equivalent based on performance and physiological testing. All the rowers had completed a 25-d post-season training-free period just prior to baseline testing. One group performed “100 %” of all training at intensities below that eliciting 75 %VO2max (LOW). The other group performed 70 % training at the same low intensities as well as 30 % of training at an intensity 50 % of the way between power at lactate threshold and power at VO2max (MIX). In practice, MIX performed high intensity training on 3 d.wk-1. All training was performed on a rowing ergometer over the 12 wk. The two groups performed virtually identical volumes of training (~1140 km on the ergometer), with ±10 % individual variation allowed to accommodate for variation in athlete standard. Results of the study are summarized in Table 5.
Sixteen of 18 subjects set new personal bests for the 2000-m ergometer test at the end of the study. The authors concluded that LOW and MIX training had similar positive effects on performance and maximal oxygen consumption. LOW training appeared to induce a greater right-shift in the blood-lactate profile during sub-maximal exercise, which did not translate to a significantly greater gain in performance. If MIX training enhanced or preserved anaerobic capacity more than LOW, this may have compensated for the observed differences in blood-lactate profile. Intensity for Recreational AthletesElite endurance athletes train 10-12 sessions and 15-30 h each week. Is the pattern of 80 % below and 20 % above lactate threshold appropriate for recreational athletes training 4-5 times and 6-10 hours per week? There are almost no published data addressing this question. Recently Esteve-Lanao (personal communication) completed an interesting study on recreational runners comparing a program that was designed to reproduce the polarized training of successful endurance athletes and compare it with a program built around much more threshold training in keeping with the ACSM exercise guidelines. The intended intensity distribution for the two training groups was: Polarized 77-3-20 % and ACSM 46-35-19 % for Zones 1, 2, and 3. However, heart-rate monitoring revealed that the actual distribution was: Polarized 65-21-14 % and ACSM 31-56-13 %. Comparing the intended and achieved distributions highlights a typical training error committed by recreational athletes. We can call it falling into a training intensity “black hole.” It is hard to keep recreational people training 45-60 min a day 3-5 days a week from accumulating a lot of training time at their lactate threshold. Training intended to be longer and slower becomes too fast and shorter in duration, and interval training fails to reach the desired intensity. The result is that most training sessions end up being performed at the same threshold intensity. Foster et al. (2001b) also found that athletes tend to run harder on easy days and easier on hard days, compared to coaches' training plans. Esteve Lanao did succeed in getting two groups to distribute intensity very differently. The group that trained more polarized, with more training time at lower intensity, actually improved their 10-km performance significantly more at 7 and 11 wk. So, recreational athletes could also benefit from keeping low- and high-intensity sessions at the intended intensity. Interval training can be performed effectively with numerous combinations of work duration, rest duration, and intensity. We have found that when subjects self-select running speed based on a standard prescription, 4-min work duration and 2-min recovery duration combine to give the highest physiological response and maintained speed (Seiler and Sjursen, 2004; Seiler and Hetlelid, 2005). However, perceptual and physiological response differences across the typical work and recovery spectrum are fairly small and performance enhancement differences are unclear at best. Some researchers have proposed that specific interval regimes (e.g., 4 × 4 min at 95 %VO2max) may be superior for achieving adaptive gains (Helgerud et al., 2007; Wisloff et al., 2007), but other research studies and our observations of athlete practice suggest that a variety of combinations of work and rest duration are effective for long-term development. Table 6 shows typical combinations of intensity and effective duration used by elite endurance athletes for workouts in the different aerobic training zones described earlier. All the examples are taken from the training diaries of elite performers. The effective durations for the different zones are utilized by highly trained athletes. For those without the same training base, similar workouts would be performed but with less total effective duration.
Case Studies of Training ManipulationCase studies are the weakest form of scientific evidence. But, for coaches and high performance athlete support teams, each elite athlete is a case study. So, we present here two case studies that we think are instructive in demonstrating the potential physiological impact of successfully manipulating training volume and intensity distribution variables at the individual level. Both cases involve Norwegian athletes who were followed closely by one of the authors (Tønnessen). Both would be considered already highly trained prior to the training reorganization. Case 1–From Soccer Pro to Elite CyclistKnut Anders Fostervold was a professional soccer player in the Norwegian elite league from 1994 to 2002. A knee injury ended his soccer career at age 30 and he decided to switch to cycling. Knut had very high natural endurance capacity and had run 5 km in 17:24 at age 12. After 15 y of soccer training at the elite level, he adopted a highly intensive training regime for cycling that was focused on training just under or at his lactate threshold and near VO2max; for example, 2-3 weekly training sessions of 4-5 × 4 min at 95 %VO2max. Weekly training volume did not exceed 10 h. After 2.5 years of this high-intensity, low-volume training, Fostervold initiated cooperation with the Norwegian Olympic Center and his training program was radically reorganized. Weekly training volume was doubled from 8-10 h to 18-20. Training volume in Zone 2 was reduced dramatically and replaced with a larger volume of training in Zone 1. Training in Zone 5 was replaced with Zones 3 and 4, such that total training volume at intensities at or above lactate threshold was roughly doubled without overstressing the athlete. The typical effective duration of interval sessions increased from ~20 min to ~ 60 min (for example 8 × 8 min at 85-90 %HRmax with 2-min recoveries). The intensity zones were initially based on heart rate but later adjusted relative to lactate and power output measurements made in the field. Table 7 shows the training intensity distribution and volume loading for the athlete during the season before and after the change in training to a high-volume program. Table 8 shows the outcome.
The athlete responded well to the training load amplification and reorganization. During the 2005 season, after 2.5 y performing a low-volume, high-intensity program, a season training with higher volume and lower average intensity resulted in marked physiological and performance improvement. Although the athlete’s training de-emphasized both training near his lactate threshold intensity and training at near VO2max, both of these physiological anchors improved markedly. Fostervold won a bronze medal in the Norwegian national time-trial championships, seconds behind former world under-23 time trial champions and Tour de France stage winners Thor Hushovd and Kurt Asle Arvesen. His failure to perform even better, given his exceptionally high VO2max, was attributed to poorer cycling efficiency and aerodynamics and a lower fractional utilization at lactate threshold compared to the best professionals with many years of specific training. In 2006 and 2007 he represented Norway in the world championship time trial. His absolute VO2max in 2005 was equal to the highest ever measured in a Norwegian athlete. Case 2–From Modern Pentathlete to RunnerPrior to 2003, Øystein Sylta was a military pentathlete (European champion in 2003). In the Fall of 2003 he decided to focus on distance running and is now nationally competitive, with personal bests for 3000-m steeplechase, 5000-m, and 10000-m of 8:31, 14:04 and 29:12 respectively. His case is interesting due to the dramatic change in training volume and intensity distribution he undertook from 2003 to 2004 and associated changes in physiological test results. Prior to 2003, Sylta trained using a high-intensity, low-volume training structure. When he agreed to try a new approach, emphasis was placed on increasing training volume with low-intensity sessions and changing his interval training. He either trained long slow distance or long intense interval sessions. However, his total training distance at intensities above his lactate threshold was reduced and redistributed. From 2002/2003 to 2003/2004 he increased his total running distance from 3,500 to 5,900 km. He also reduced his strength training from 100 annual hours to 50. Table 9 shows a typical hard training week in the Fall of 2003 and Fall of 2004, and Table 10 summarizes the running specific training. His physiological adaption to the first year of restructured training is documented in Table 11.
From 2003 to 2009, Sylta’s threshold running speed increased from 16.9 to 19.5 km.h-1. From 2002 to 2009, his 10-km time improved from 31:44 to 29:12, and 3000-m steeplechase from 9:11 to 8:31. In the first five months of training reorganization, his 3000-m steeple result improved by 30 s. Both these case studies demonstrate that even in already well trained athletes, meaningful improvements in physiological test results and performance may occur with appropriate training intensity and volume manipulation. Both athletes showed clear improvements in physiological testing despite reductions in HIT training. Both seemed to respond positively to an increase in total training volume and specifically, more low-intensity volume. Valid Comparisons of Training InterventionsMatching training programs based on total work or oxygen consumption seems sensible in a laboratory. As we noted earlier, this has been the preferred method of matching when comparing the effects of continuous and interval training in controlled studies. Unfortunately, it is not realistic from the view of athletes pursuing maximal performance. They do not compare training sessions or adjust training time to intensity in this manner. A key issue here is the non-linear impact of exercise intensity on the manageable accumulated duration of intermittent exercise. We have exemplified this in Table 12 by comparing some typical training sessions from the training of elite athletes.
The point we want to make is that the athlete’s perception of the stress of performing 4 × 15 min at 85 %VO2max is about the same as that of performing 6 × 4 min at 95 %VO2max, even though total work performed is very different. If we want to answer a question like, “is near VO2max interval training more effective for achieving performance gains in athletes than training at the maximal lactate steady state?”, then the matching of training bouts has to be realistic from the perspective of perceived stress and how athletes train. Future studies of training intensity effects on adaptation and performance should take this issue of ecological validity into account. ConclusionsOptimization of training methods is an area of great interest for scientists, athletes, and fitness enthusiasts. One challenge for sport scientists is to translate short-term training intervention study results to long-term performance development and fitness training organization. Currently, there is great interest in high-intensity, short-duration interval training programs. However, careful evaluation of both available research and the training methods of successful endurance athletes suggests that we should be cautious not to over-prescribe high-intensity interval training or exhort the advantages of intensity over duration. Here are some conclusions that seem warranted by the available data and experience from observations of elite performers: • There is reasonable evidence that an ~80:20 ratio of low to high intensity training (HIT) gives excellent long-term results among endurance athletes training daily. • Low intensity (typically below 2 mM blood lactate), longer duration training is effective in stimulating physiological adaptations and should not be viewed as wasted training time. • Over a broad range, increases in total training volume correlate well with improvements in physiological variables and performance. • HIT should be a part of the training program of all exercisers and endurance athletes. However, about two training sessions per week using this modality seems to be sufficient for achieving performance gains without inducing excessive stress. • The effects of HIT on physiology and performance are fairly rapid, but rapid plateau effects are seen as well. To avoid premature stagnation and ensure long-term development, training volume should increase systematically as well. • When already well-trained athletes markedly intensify training with more HIT over 12 to ~45 wk, the impact is equivocal. • In athletes with an established endurance base and tolerance for relatively high training loads, intensification of training may yield small performance gains at acceptable risk. • An established endurance base built from reasonably high volumes of training may be an important precondition for tolerating and responding well to a substantial increase in training intensity over the short term. • Periodization of training by elite athletes is achieved with reductions in total volume, and a modest increase in the volume of training performed above the lactate threshold. An overall polarization of training intensity characterizes the transition from preparation to competition mesocycles. The basic intensity distribution remains similar throughout the year. References
Aasen S (2008). Utholdenhet- trening som gir
resultater. Akilles Forlag: Oslo, Norway Acevedo
EO, Goldfarb AH (1989). Increased training intensity effects on plasma
lactate, ventilatory threshold, and endurance. Medicine and Science in Sports
and Exercise 21, 563-568 Achten
J, Jeukendrup AE (2003). Maximal fat oxidation during exercise in trained men.
International Journal of Sports Medicine 24, 603-608 Ahmetov,
II, Rogozkin VA (2009). Genes, Athlete Status and Training - An Overview.
Medicine and Sport Science 54, 43-71 Åstrand
I, Åstrand PO, Christiensen EH, Hedman R (1960). Intermittent muscular work.
Acta Physiolologica Scandinavica 48, 448-453 Åstrand
I ÅP, Christiansen EH, Hedman R (1960). Myohemoglobin as an oxygen store in
man. Acta Physiolologica Scandinavica 48, 454-460 Åstrand
PO, Rodahl, K.R. (1986). Physical Training. In: Textbook of Work Physiology.
McGraw-Hill: Singapore. 412-476 Beneke
R, von Duvillard SP (1996). Determination of maximal lactate steady state
response in selected sports events. Medicine and Science in Sports and
Exercise 28, 241-246 Beneke
R, Leithauser RM, Hutler M (2001). Dependence of the maximal lactate steady
state on the motor pattern of exercise. British Journal of Sports Medicine
35, 192-196 Berger
NJ, Tolfrey K, Williams AG, Jones AM (2006). Influence of continuous and
interval training on oxygen uptake on-kinetics. Medicine and Science in
Sports and Exercise 38, 504-512 Bhambhani
Y, Singh M (1985). The effects of three training intensities on VO2 max and
VE/VO2 ratio. Canadian Journal of Applied Sport Sciences 10, 44-51 Billat
V, Lepretre PM, Heugas AM, Laurence MH, Salim D, Koralsztein JP (2003).
Training and bioenergetic characteristics in elite male and female Kenyan
runners. Medicine and Science in Sports and Exercise 35, 297-304; discussion
305-296 Billat
VL, Flechet B, Petit B, Muriaux G, Koralsztein JP (1999). Interval training
at VO2max: effects on aerobic performance and overtraining markers. Medicine
and Science in Sports and Exercise 31, 156-163 Billat
VL, Demarle A, Slawinski J, Paiva M, Koralsztein JP (2001). Physical and
training characteristics of top-class marathon runners. Medicine and Science
in Sports and Exercise 33, 2089-2097 Brigelius-Flohe
R (2009). Commentary: oxidative stress reconsidered. Genes and Nutrition 4,
161-163 Catalucci
D, Latronico MV, Ellingsen O, Condorelli G (2008). Physiological myocardial
hypertrophy: how and why? Frontiers in Bioscience 13, 312-324 Chakravarthy
MV, Booth FW (2004). Eating, exercise, and "thrifty" genotypes:
connecting the dots toward an evolutionary understanding of modern chronic
diseases. Journal of Applied Physiology 96, 3-10 Christensen
EH (1960). [Interval work and interval training.]. Internationale Zeitschrift
fur Angewandte Physiologie Einschliesslich Arbeitsphysiologie 18, 345-356 Christensen
EH, Hedman R, Saltin B (1960). Intermittant and continuous running. Acta
Physiolologica Scandinavica 50, 269-286 Cunningham
DA, McCrimmon D, Vlach LF (1979). Cardiovascular response to interval and
continuous training in women. European Journal of Applied Physiology 41,
187-197 Daniels
J, Scardina N (1984). Interval training and performance. Sports Medicine 1,
327-334 Daussin
FN, Ponsot E, Dufour SP, Lonsdorfer-Wolf E, Doutreleau S, Geny B, Piquard F,
Richard R (2007). Improvement of VO2max by cardiac output and oxygen
extraction adaptation during intermittent versus continuous endurance
training. European Journal of Applied Physiology 101, 377-383 Daussin
FN, Zoll J, Dufour SP, Ponsot E, Lonsdorfer-Wolf E, Doutreleau S, Mettauer B,
Piquard F, Geny B, Richard R (2008a). Effect of interval versus continuous
training on cardiorespiratory and mitochondrial functions: relationship to
aerobic performance improvements in sedentary subjects. American Journal of
Physiology 295, R264-272 Daussin
FN, Zoll J, Ponsot E, Dufour SP, Doutreleau S, Lonsdorfer E, Ventura-Clapier
R, Mettauer B, Piquard F, Geny B, Richard R (2008b). Training at high
exercise intensity promotes qualitative adaptations of mitochondrial function
in human skeletal muscle. Journal of Applied Physiology 104, 1436-1441 Diaz F,
Moraes CT (2008). Mitochondrial biogenesis and turnover. Cell Calcium 44,
24-35 Eddy
DO, Sparks KL, Adelizi DA (1977). The effects of continuous and interval
training in women and men. European Journal of Applied Physiology 37, 83-92 Edge J,
Bishop D, Goodman C (2006). The effects of training intensity on muscle
buffer capacity in females. European Journal of Applied Physiology 96, 97-105 Esteve-Lanao
J, San Juan AF, Earnest CP, Foster C, Lucia A (2005). How do endurance
runners actually train? Relationship with competition performance. Medicine
and Science in Sports and Exercise 37, 496-504 Esteve-Lanao
J, Foster C, Seiler S, Lucia A (2007). Impact of training intensity
distribution on performance in endurance athletes. Journal of Strength and
Conditioning Research 21, 943-949 Evertsen
F, Medbo JI, Jebens E, Nicolaysen K (1997). Hard training for 5 mo increases
Na(+)-K+ pump concentration in skeletal muscle of cross-country skiers.
American Journal of Physiology 272, R1417-1424 Evertsen
F, Medbo JI, Jebens E, Gjovaag TF (1999). Effect of training on the activity
of five muscle enzymes studied on elite cross-country skiers. Acta
Physiologica Scandinavica 167, 247-257 Evertsen
F, Medbo JI, Bonen A (2001). Effect of training intensity on muscle lactate
transporters and lactate threshold of cross-country skiers. Acta Physiologica
Scandinavica 173, 195-205 Fields
RD (2006). Nerve impulses regulate myelination through purinergic signalling.
Novartis Foundation Symposium 276, 148-158; discussion 158-161, 233-147, 275-181 Fiskerstrand
A, Seiler KS (2004). Training and performance characteristics among Norwegian
international rowers 1970-2001. Scandinavian Journal of Medicine and Science
in Sports 14, 303-310 Foster
C, Daines E, Hector L, Snyder AC, Welsh R (1996). Athletic performance in
relation to training load. Wisconsin Medical Journal 95, 370-374 Foster
C (1998). Monitoring training in athletes with reference to overtraining
syndrome. Medicine and Science in Sports and Exercise 30, 1164-1168 Foster
C, Florhaug JA, Franklin J, Gottschall L, Hrovatin LA, Parker S, Doleshal P,
Dodge C (2001a). A new approach to monitoring exercise training. Journal of
Strength and Conditioning Research 15, 109-115 Foster
C, Heiman KM, Esten PL, Brice G, Porcari J (2001b). Differences in
perceptions of training by coaches and athletes. South African Journal of
Sports Medicine 8, 3-7 Foster
C, Hoyos J, Earnest C, Lucia A (2005). Regulation of energy expenditure
during prolonged athletic competition. Medicine and Science in Sports and Exercise
37, 670-675 Frank
D, Kuhn C, Brors B, Hanselmann C, Ludde M, Katus HA, Frey N (2008). Gene
expression pattern in biomechanically stretched cardiomyocytes: evidence for
a stretch-specific gene program. Hypertension 51, 309-318 Fry AC,
Schilling BK, Weiss LW, Chiu LZ (2006). beta2-Adrenergic receptor
downregulation and performance decrements during high-intensity resistance
exercise overtraining. Journal of Applied Physiology 101, 1664-1672 Gaskill
SE, Serfass RC, Bacharach DW, Kelly JM (1999). Responses to training in
cross-country skiers. Medicine and Science in Sports and Exercise 31,
1211-1217 Gladden
LB (2004). Lactate metabolism: a new paradigm for the third millennium.
Journal of Physiology 558, 5-30 Gledhill
N, Cox D, Jamnik R (1994). Endurance athletes' stroke volume does not
plateau: major advantage is diastolic function. Medicine and Science in
Sports and Exercise 26, 1116-1121 Gomez-Cabrera
MC, Domenech E, Romagnoli M, Arduini A, Borras C, Pallardo FV, Sastre J, Vina
J (2008). Oral administration of vitamin C decreases muscle mitochondrial
biogenesis and hampers training-induced adaptations in endurance performance.
American Journal of Clinical Nutrition 87, 142-149 Gorostiaga
EM, Walter CB, Foster C, Hickson RC (1991). Uniqueness of interval and
continuous training at the same maintained exercise intensity. European
Journal of Applied Physiology 63, 101-107 Gregory
LW (1979). The development of aerobic capacity: a comparison of continuous
and interval training. Research Quarterly 50, 199-206 Gullich
A, Emrich E, Seiler S (2009). Training methods and intensity distribution of
young world-class rowers. International Journal of Sport Physiology and
Performance 4, In Press Halson
SL, Jeukendrup AE (2004). Does overtraining exist? An analysis of overreaching
and overtraining research. Sports Medicine 34, 967-981 Hansen
AK, Fischer CP, Plomgaard P, Andersen JL, Saltin B, Pedersen BK (2005).
Skeletal muscle adaptation: training twice every second day vs. training once
daily. Journal of Applied Physiology 98, 93-99 Helgerud
J, Hoydal K, Wang E, Karlsen T, Berg P, Bjerkaas M, Simonsen T, Helgesen C,
Hjorth N, Bach R, Hoff J (2007). Aerobic high-intensity intervals improve
VO2max more than moderate training. Medicine and Science in Sports and Exercise
39, 665-671 Henriksson
J, Reitman JS (1976). Quantitative measures of enzyme activities in type I
and type II muscle fibres of man after training. Acta Physiologica
Scandinavica 97, 392-397 Hill
AV, Long CNH, Lupton H (1924a). Muscular exercise, lactic acid, and the
supply and utilization of oxygen. Parts I-III. . Proceedings of the Royal
Society of London. Series B: Biological Sciences 96, 438-475 Hill
AV, Long CNH, Lupton H (1924b). Muscular exercise, lactic acid, and the
supply and utilization of oxygen. Parts IV-VI. Proceedings of the Royal
Society of London. Series B: Biological Sciences 97, 84-138 Holloszy
JO (2008). Regulation by exercise of skeletal muscle content of mitochondria
and GLUT4. Journal of Physiology and Pharmacology 59 Suppl 7, 5-18 Hoppeler
H, Klossner S, Fluck M (2007). Gene expression in working skeletal muscle.
Advances in Experimental Medicine and Biology 618, 245-254 Ingham
SA, Carter H, Whyte GP, Doust JH (2008). Physiological and performance
effects of low- versus mixed-intensity rowing training. Medicine and Science
in Sports and Exercise 40, 579-584 Ishibashi
T, Dakin KA, Stevens B, Lee PR, Kozlov SV, Stewart CL, Fields RD (2006).
Astrocytes promote myelination in response to electrical impulses. Neuron 49,
823-832 Joseph
AM, Pilegaard H, Litvintsev A, Leick L, Hood DA (2006). Control of gene
expression and mitochondrial biogenesis in the muscular adaptation to
endurance exercise. Essays in Biochemistry 42, 13-29 Kamo M
(2002). Discharge behavior of motor units in knee extensors during the
initial stage of constant-force isometric contraction at low force level.
European Journal of Applied Physiology 86, 375-381 Laughlin
MH, Roseguini B (2008). Mechanisms for exercise training-induced increases in
skeletal muscle blood flow capacity: differences with interval sprint
training versus aerobic endurance training. Journal of Physiology and
Pharmacology 59 Suppl 7, 71-88 Lehmann
MJ, Lormes W, Opitz-Gress A, Steinacker JM, Netzer N, Foster C, Gastmann U
(1997). Training and overtraining: an overview and experimental results in
endurance sports. Journal of Sports Medicine and Physical Fitness 37, 7-17 Lindsay
FH, Hawley JA, Myburgh KH, Schomer HH, Noakes TD, Dennis SC (1996). Improved
athletic performance in highly trained cyclists after interval training.
Medicine and Science in Sports and Exercise 28, 1427-1434 Lucia
A, Hoyos J, Carvajal A, Chicharro JL (1999). Heart rate response to
professional road cycling: the Tour de France. International Journal of
Sports Medicine 20, 167-172 Lucia
A, Hoyos J, Santalla A, Earnest C, Chicharro JL (2003). Tour de France versus
Vuelta a Espana: which is harder? Medicine and Science in Sports and Exercise
35, 872-878 MacDougall
D, Sale D (1981). Continuous vs. interval training: a review for the athlete
and the coach. Canadian Journal of Applied Sport Sciences 6, 93-97 Marcuello
A, Gonzalez-Alonso J, Calbet JA, Damsgaard R, Lopez-Perez MJ, Diez-Sanchez C
(2005). Skeletal muscle mitochondrial DNA content in exercising humans.
Journal of Applied Physiology 99, 1372-1377 McConell
GK, Lee-Young RS, Chen ZP, Stepto NK, Huynh NN, Stephens TJ, Canny BJ, Kemp
BE (2005). Short-term exercise training in humans reduces AMPK signalling
during prolonged exercise independent of muscle glycogen. Journal of Physiology
568, 665-676 McPhee
JS, Williams AG, Stewart C, Baar K, Schindler JP, Aldred S, Maffulli N,
Sargeant AJ, Jones DA (2009). The training stimulus experienced by the leg
muscles during cycling in humans. Experimental Physiology 94, 684-694 Mujika
I, Chatard JC, Busso T, Geyssant A, Barale F, Lacoste L (1995). Effects of
training on performance in competitive swimming. Canadian Journal of Applied
Physiology 20, 395-406 Nordsborg
N, Bangsbo J, Pilegaard H (2003). Effect of high-intensity training on
exercise-induced gene expression specific to ion homeostasis and metabolism.
Journal of Applied Physiology 95, 1201-1206 Ojuka
EO (2004). Role of calcium and AMP kinase in the regulation of mitochondrial
biogenesis and GLUT4 levels in muscle. Proceedings of the Nutrition Society
63, 275-278 Overend
TJ, Paterson DH, Cunningham DA (1992). The effect of interval and continuous
training on the aerobic parameters. Canadian Journal of Sport Sciences 17,
129-134 Pelliccia
A, Culasso F, Di Paolo FM, Maron BJ (1999). Physiologic left ventricular
cavity dilatation in elite athletes. Annals of Internal Medicine 130, 23-31 Poole
DC, Gaesser GA (1985). Response of ventilatory and lactate thresholds to
continuous and interval training. Journal of Applied Physiology 58, 1115-1121 Ristow
M, Zarse K, Oberbach A, Kloting N, Birringer M, Kiehntopf M, Stumvoll M, Kahn
CR, Bluher M (2009). Antioxidants prevent health-promoting effects of
physical exercise in humans. Proceedings of the National Academy of Sciences
of the United States of America 106, 8665-8670 Robinson
DM, Robinson SM, Hume PA, Hopkins WG (1991). Training intensity of elite male
distance runners. Medicine and Science in Sports and Exercise 23, 1078-1082 Saltin
B, Nazar K, Costill DL, Stein E, Jansson E, Essen B, Gollnick D (1976). The
nature of the training response; peripheral and central adaptations of
one-legged exercise. Acta Physiologica Scandinavica 96, 289-305 Schumacher
YO, Mueller P (2002). The 4000-m team pursuit cycling world record:
theoretical and practical aspects. Medicine and Science in Sports and
Exercise 34, 1029-1036 Seiler
KS, Kjerland GO (2006). Quantifying training intensity distribution in elite
endurance athletes: is there evidence for an "optimal" distribution?
Scandinavian Journal of Medicine and Science in Sports 16, 49-56 Seiler
S, Sjursen JE (2004). Effect of work duration on physiological and rating
scale of perceived exertion responses during self-paced interval training.
Scandinavian Journal of Medicine and Science in Sports 14, 318-325 Seiler
S, Hetlelid KJ (2005). The impact of rest duration on work intensity and RPE
during interval training. Medicine and Science in Sports and Exercise 37,
1601-1607 Seiler
S, Haugen O, Kuffel E (2007). Autonomic recovery after exercise in trained
athletes: intensity and duration effects. Medicine and Science in Sports and
Exercise 39, 1366-1373 Sheikh
F, Raskin A, Chu PH, Lange S, Domenighetti AA, Zheng M, Liang X, Zhang T,
Yajima T, Gu Y, Dalton ND, Mahata SK, Dorn GW, 2nd, Heller-Brown J, Peterson
KL, Omens JH, McCulloch AD, Chen J (2008). An FHL1-containing complex within
the cardiomyocyte sarcomere mediates hypertrophic biomechanical stress
responses in mice. Journal of Clinical Investigation 118, 3870-3880 Steinacker
JM, Lormes W, Lehmann M, Altenburg D (1998). Training of rowers before world
championships. Medicine and Science in Sports and Exercise 30, 1158-1163 Stepto
NK, Hawley JA, Dennis SC, Hopkins WG (1999). Effects of different
interval-training programs on cycling time-trial performance. Medicine and
Science in Sports and Exercise 31, 736-741 Talanian
JL, Galloway SD, Heigenhauser GJ, Bonen A, Spriet LL (2007). Two weeks of
high-intensity aerobic interval training increases the capacity for fat oxidation
during exercise in women. Journal of Applied Physiology 102, 1439-1447 Thompson
P (2005). Break through the speed barrier with the "new interval
training". Athletics Weekly 59, 62-63 Wenger
HA, Macnab RB (1975). Endurance training: the effects of intensity, total
work, duration and initial fitness. Journal of Sports Medicine and Physical
Fitness 15, 199-211 Weston
AR, Myburgh KH, Lindsay FH, Dennis SC, Noakes TD, Hawley JA (1997). Skeletal
muscle buffering capacity and endurance performance after high-intensity
interval training by well-trained cyclists. European Journal of Applied
Physiology 75, 7-13 Wisloff
U, Stoylen A, Loennechen JP, Bruvold M, Rognmo O, Haram PM, Tjonna AE,
Helgerud J, Slordahl SA, Lee SJ, Videm V, Bye A, Smith GL, Najjar SM, Ellingsen
O, Skjaerpe T (2007). Superior cardiovascular effect of aerobic interval
training versus moderate continuous training in heart failure patients: a
randomized study. Circulation 115, 3086-3094 Yan Z
(2009). Exercise, PGC-1alpha, and metabolic adaptation in skeletal muscle.
Applied Physiology Nutrition and Metabolism 34, 424-427 Yeo WK,
Paton CD, Garnham AP, Burke LM, Carey AL, Hawley JA (2008). Skeletal muscle
adaptation and performance responses to once a day versus twice every second
day endurance training regimens. Journal of Applied Physiology 105, 1462-1470 Zapico
AG, Calderon FJ, Benito PJ, Gonzalez CB, Parisi A, Pigozzi F, Di Salvo V
(2007). Evolution of physiological and haematological parameters with
training load in elite male road cyclists: a longitudinal study. Journal of
Sports Medicine and Physical Fitness 47, 191-196 Zhou B,
Conlee RK, Jensen R, Fellingham GW, George JD, Fisher AG (2001). Stroke
volume does not plateau during graded exercise in elite male distance
runners. Medicine and Science in Sports and Exercise 33, 1849-1854 Published Nov 2009 |
|||||||||||||||||||||||||||||||||||||||||||||||||||||||||||||||||||||||||||||||||||||||||||||||||||||||||||||||||||||||||||||||||||||||||||||||||||||||||||||||||||||||||||||||||||||||||||||||||||||||||||||||||||||||||||||||||||||||||||||||||||||||||||||||||||||||||||||||||||||||||||||||||||||||||||||||||||||||||||||||||||||||||||||||||||||||||||||||||||||||||||||||||||||||||||