![]()
![]()
Coaches Learn to Use Video Analysis
Todd Allinger, Sport Science Medicine and Education Resource Center, The Orthopedic Specialty Hospital; Salt Lake City, Utah, USA
|
|
Coaches Learn to Use Video Analysis |
|
|
Todd Allinger, Sport Science Medicine and Education Resource Center, The Orthopedic Specialty Hospital; Salt Lake City, Utah, USA |
Coaches can become more skilled in the use of sport science through coaching certification programs. I have been involved in a program run by the National Coaching Institute in Canada, in which coaches learn practical skills of video analysis. In this article I'll first describe the education program. I'll then explain how we used video analysis to enhance performance in acro skiing and in synchronized swimming. Finally, I'll give practical advice for doing your own video analysis in any sport.
Coach Education
Canada has a strong National Coaching Certification Program that began
in 1974. Over 600,000 coaches are now certified in 60 sports from
Levels 1 to 5. Even at the community level, coaches are required to
complete at least Level 1 before they are allowed to lead a team of
kids. Certification requires a combination of classes in coaching
theory (applicable to all sports), technical theory (sport specific),
and practical experience (coaching).
The National Coaching Institutes (NCI) in Canada provide an environment where coaches can obtain Level 4 certification by completing 12 tasks and mentoring with a master coach in a two-year program. As an instructor for the biomechanics task at the NCI in Calgary, Alberta, I worked with some effective coaches who used their biomechanics projects to evaluate if one technique or equipment in their sport is better than another. I'll describe two studies that should stimulate other coaches to use these simple techniques.
Better Pole Length for Acro Ski Jumps
This study was performed by
Todd Allison. Todd is
Acro coach for the Canadian Freestyle Ski Association in Calgary.
|
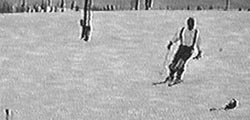
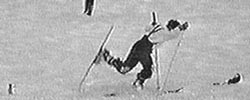
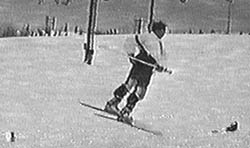
Inside jump showing the
approach (top), right ski edge set and pole plant (middle),
and flight after 360 degrees of counter clockwise rotation
(bottom). Skier is using the short pole grip (left hand).
Markers at the lower corners in pictures identify the fall
line (down hill to the left). |
|
Ski poles are used to vault the athlete during a jump, so Todd set out to determine how the height of the pole grip above the snow affected performance. The rule of thumb was that the ski pole should be long enough so that when it is planted in the snow and the grip is held normally, the extended arm is parallel to the ground.
Ten national team skiers (from four countries) performed 10 jumps: 5 with their traditional length poles and 5 with a lower pole grip (short), which allowed for a 90 degrees bend of the elbow at take-off. An 8-mm video camera recorded the jumps at a right angle to the take-off location, approximately 18 meters away. Two markers placed on the fall line indicated the take-off area. Frames of video were selected that represented the take-off, the peak height of the jump, and the landing. The take-off boot was digitized manually for the three selected frames using a personal computer with a frame grabber. The number of pixels recorded from digitization were converted to distances in meters after digitizing a video frame that had a meter stick that was held in the take-off area.
Most skiers thought they could jump higher if the pole was gripped higher, similar to pole vaulting. However, the skiers jumped 5.5 cm (11 %) higher on average with the shorter pole grip than with the traditional length pole. Apparently, a lower grip allowed the shoulder and elbow joints to provide more downward impulse than when the pole was gripped higher. An increase in jump height of this order should improve the judged score.
Better Technique for Continuous Spin
Scull in Synchro Swimming
This project was carried out by Erin Gillings of the
Aquabelles Synchronized Swimming Club, Calgary. She addressed the
question of which technique is better for the continuous spin scull
in synchronized swimming: split scull or double-overhead scull.
|
Side view (A) and bottom
view (B) of the split scull (left) and double-overhead scull
(right) techniques. |
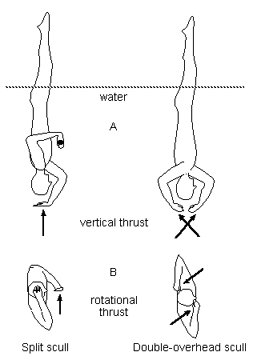 |
In the continuous spin scull, the athlete projects the legs vertically above the water and spins while the body is slowly lowered into the water. From the judges' perspective, the key elements are the initial height of the legs above the water, the vertical alignment, the number of spins before the feet are submerged, and a constant revolution speed. In the split scull, one hand sculls above the head to provide vertical thrust and the other hand sculls in front of the chest to rotate the body. In the double-overhead scull both hands are above the swimmer's head and provide vertical thrust and rotation, depending on the angulation of the hands while sculling.
Three Olympic silver medalists (1996, Atlanta) from the Canadian synchronized swimming team performed four continuous spins: twice with the split scull and twice with the double-overhead scull techniques. The athletes were video taped (30 frames/second) from an underwater viewing window. The coordinates of the pubic bone and the surface of the water between the legs were digitized for every 180 degrees of body rotation. From the digitized points the height of the toes above the water, leg tilt angle, spin rate, and drop space were calculated.
Results from this video analysis give strong evidence that the double-overhead technique is superior to the split scull technique for the continuous spin scull. The double-overhead scull produces greater height (5.1 cm and 5.0 cm higher for two of the three athletes), more rotations (6.5 vs 4.6 revolutions), and a smoother descent into the water than the split scull.
Biomechanically, the double-overhead scull should produce a better vertical alignment and less motion about the axis of the spin than the split scull. The double-overhead technique creates a pure moment around the axis of rotation. With the split scull technique, the hand in front of chest produces the spin but is not counter balanced by another force on the other side of the body. As a result, upper body contortions below the water are required to keep the legs vertical. The result is less leg height and fewer revolutions.
How to do Video Analysis
Both of these studies answered an important performance
question through measurements taken from a video. If coaches simply
view tapes--so-called qualitative analysis--they might miss changes
in performance. The same video tapes used for qualitative analysis
can be used for quantitative evaluations if a few simple steps are
followed.
First, the procedure for collecting video data:
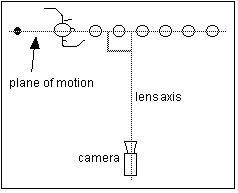
|
Top view of camera setup. |
 |
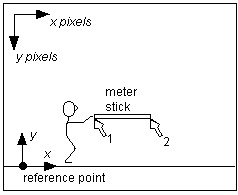
|
Frame showing meter stick to be digitized for calibration. |
 |
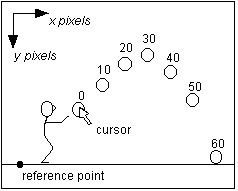
You get data for the positions of objects by digitizing the video. An example of a shotput flying through the air is shown.
|
Series of 7 frames of the
flight of a shot put. Frame 0 is just after release from the
hand. The position of the shot in every 10th frame is
shown. |
 |
Follow these steps for digitizing with a computer :
If no computer is available, the video can be digitized directly from the television screen as follows:
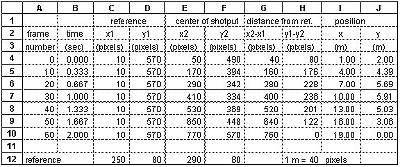
Now you can convert the digitized points (pixels) or the distances measured off the screen (mm) into true distances:
The velocity of a point can be calculated from the position data,
because the average velocity between two points equals the change in
distance divided by the change in time:
v = (p2 - p1) / (t2 - t1). Here's how
to do it:
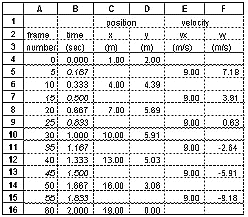
Velocity is calculated here as an average from one digitized frame
to the next. Therefore, the time related to this velocity is midway
between the two digitized frames. For example, the velocity of the
shotput in the x direction at time = 0.167 s is:
vx5 = (px10 - px0) / (t10 - t0) = (4.0
- 1.0) / (0.333 - 0.0) = 9.00 m/s
Here are the calculations of velocities in the x and y directions for
the data in the above table:
For more information on calculating angles and accelerations consult a source such as Hay (1985).
Reference
Hay, J.G. (1985).The biomechanics of
sports techniques. Prentice-Hall: Englewood Cliffs, NJ.