A Decision Tree for Controlled Trials Alan M Batterham, Will G Hopkins Sportscience 9, 33-39, 2005
(sportsci.org/jour/05/wghamb.htm)
|
|
Time Series vs Other
Controlled Trials1 Posts-Only
vs Fully Controlled Trial1 Fully
Controlled Trial vs Crossover1 Fully
Controlled vs Simple Crossovers1 Appendix
1: Sample Size for Crossovers1 Update Jan 2023. The figures have
been updated here and in the research
designs slideshow with more consistent names for
the designs and with less specific advice about the effect of reliability on sample
size. Previously the advice was specific to a smallest important difference
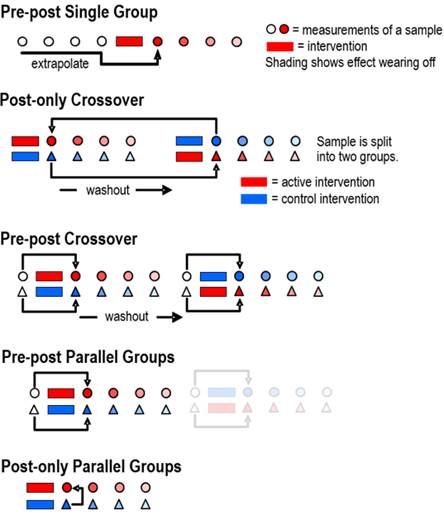
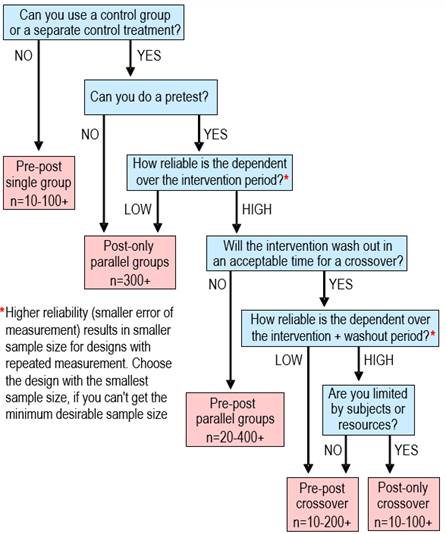
or change in a mean determined by standardization. Update June 2017. We have removed assertions about post-only controlled trials having smaller sample sizes than pre-post controlled trials. Inclusion of a pre-test as a covariate makes the pre-post design more efficient than the post-only design, regardless of reliability. A study in which you measure the effect of a treatment or other intervention is usually called an experimental trial. Inevitably the study is a controlled experimental trial, because you include measurements to control or account for what would have happened if you hadn't intervened. The difference or change between the measurements is the effect of the treatment. Such studies can give definitive estimates of effects, especially when the subjects represent a random sample of a population, when the subjects are randomized to the treatments, and when subjects and researchers do not know which treatment is being administered (Hopkins, 2000; see also Altman et al., 2001, for an explanation of randomization, blinding, and other strategies to avoid bias in controlled trials). In a first draft of this article we identified four kinds of controlled trial, which we named posts-only trials, fully controlled (parallel-groups) trials, fully controlled crossovers, and simple crossovers. The reviewer suggested that we include quasi-experimental or time-series trials. Figure 1 shows a schematic for these five kinds of trial. In this article we provide and explain a decision tree (Figure 2) for choosing between them when you plan an intervention, and we give suggestions for the analyses.
The present article should be read in conjunction with the article about spreadsheets for fully controlled trials and simple crossovers, where there is a detailed treatment of the analyses (Hopkins, 2003). See also the In-brief item that introduces the spreadsheet for fully controlled crossovers in this issue. These articles and the spreadsheets apply mainly to outcome measures (dependent variables) that are numeric and continuous: the primary measures of distance, mass, time and current, and derived measures such as force, power, concentration and voltage. The articles and spreadsheets apply also to variables representing counts and proportions after appropriate transformation, which is provided in the spreadsheets. Controlled trials in which the outcome measure is a nominal or binary variable (such as ill or healthy, injured or uninjured, winner or loser) are almost invariably performed as posts-only trials, with all subjects starting off on the same level (e.g., uninjured). The methods of analysis for binary variables are usually logistic regression and other forms of generalized linear modeling that are beyond the scope of this article. However, coded as 0 and 1, these variables can be analyzed using spreadsheets, because the central limit theorem ensures that the t statistic provides accurate confidence limits with the large-ish sample sizes that such variables need. This t-test approach will work with these variables for all types of controlled trials, but the considerations about sample size and individual responses in the present article do not apply. Inclusion of covariates in the analysis requires generalized lnear modeling. Time
Series vs Other Controlled Trials
The first decision in the decision tree concerns the use of a control group or treatment. In some situations there is no opportunity to use a control, but you are still interested in quantifying the effect of a treatment. If you perform only one test before and one test after the treatment, you can estimate the change in the outcome measure, but you won't know how much of the change would have occurred in the absence of the treatment. You can address this problem to some extent by performing a series of measurements to establish a baseline, then estimating the deviation from this baseline during or after the treatment. The baseline measurements serve as a kind of control for the experimental treatment. Deviations from the baseline during or after the treatment could still be coincidental rather than due to the treatment, but only a properly controlled trial or crossover will remove the doubt. Hence this type of controlled trial is the weakest and should be considered a last resort. The intuitive way to account for any trend in the baseline measurements is to extrapolate the trend beyond the baseline to the measurements taken during or after the experimental treatment. The statistical analysis that reflects this intuitive approach is within-subject modeling. You fit a separate straight line (or a curve, if necessary) to the baseline points for each subject, then use it to predict what each subject's baseline measurements would have been at the time of the later measurements. A series of paired t tests provides confidence limits for the differences. The spreadsheet for simple crossovers (Hopkins, 2003) will perform these analyses. It is also possible to fit a line or curves to the points during or after the treatment, then use a series of paired t tests to compare predictions at chosen times. A more sophisticated approach involves mixed modeling to account for different magnitudes of error at different time points and any fixed effects, such as subject characteristics. To the extent that the analysis for a time series is the same as that for a crossover, the sample size can also be similar. The crucial factor is the error of measurement between the extrapolated baseline and the post test, which will depend on the number of baseline measurements and the extent of extrapolation (time between baseline tests and post tests), as well as the usual error of measurement over the time frame of the repeated measurements in the baseline and between baseline and post test. The computations are complex and the problem might be better addressed by performing simulations. If the resulting error is small relative to smallest worthwhile effects, a sample size <10 is possible, but to ensure representativeness, minimum sample size should be ~10. Larger errors can result in a sample size of hundreds. Posts-Only vs Fully
Controlled Trial
Inclusion of a pretest as a covariate in a controlled trial always makes the precision of the treatment effect better than in a post-only analysis, and the pretest is a prime candidate for a moderator explaining individual responses. A post-only analysis should therefore be performed only if the "experiment" is a natural one, where a population subgroup has been exposed to something potentially beneficial or harmful, and the mean for that group is compared with controls who have not experienced the exposure. The analysis is a simple comparison of means, allowing for different standard deviations in the two groups and for a different interaction between the dependent variable and subject characteristics that could explain the differences in the means. The spreadsheet for comparing two group means at this site allows for one such covariate and performs a comparsion of the standard deviations to address the question of individual differences (or individual responses to the natural exposure. Most controlled trials where injury or illness is the outcome involve post-only analyses, since in the "pretest" either all subjects are free of injury or illness, or they are all injured or ill. The dependent variable in such analyses is binary, and the analyses require log-hazards or proportional-hazards regression for incidence studies or log-odds (logistic) regression for prevalence studies (the "natural" experiment). In his commentary to our original article, the reviewer called our attention to a design known as the Solomon 4-group, which combines the two posts-only groups with the two parallel groups of a fully controlled trial. You would use this design only if you wanted to estimate the extent to which a pre-test modifies the effect of the experimental treatment relative to the control. The magnitude of the modification is given by the effect of the treatment in the fully controlled trial minus its effect in the posts-only trial, with confidence limits given by combining the sampling standard errors of the two effects. The existence of this design highlights a further advantage of the posts-only design: it produces the least disturbance of the subjects and must therefore be regarded as providing the criterion measure of the effect of a treatment. Fully Controlled Trial vs
Crossover
Designs in which subjects are tested before and after an intervention in principle allow the researcher to assess the success of the intervention with each subject. In practice the ability to make an assessment depends on the relative magnitudes of error of measurement and smallest worthwhile effect (Hopkins, 2004), and the outcome may be unclear for many subjects. Nevertheless, the possibility of individual assessment can be a powerful motivator for participation in the study. In this respect, crossovers are better than a fully controlled trial. In a fully controlled trial, only one group of subjects receives the treatment that the researchers think might work. Bias can therefore arise from exclusion of subjects who will not consent to the chance of ending up in a control or other group. In unblinded fully controlled trials, subjects who end up in a control group may show resentful demoralisation (Dunn, 2002) by failing to comply with the requirements of the study or by opting out before the post test. Motivation to perform well in a physically demanding test may also be lower for such subjects and for control subjects generally. Resentful demoralization may be balanced to some extent by its converse, compensatory rivalry (also known as the Avis effect), but the end result is effectively individual responses to the control treatment, which increase the error of measurement. Crossovers eliminate or reduce the biases arising from these patient preference effects, because all subjects receive all treatments, so it is in their interest to comply with and perform well for all treatments, if they want to know how well the treatments work for them. Crossovers are not without problems. As shown in Figure 2, the main impediment to their use is the time required to wash out the effects of the treatment(s). You can't perform an experimental study to determine the period, because it would amount to an extended fully controlled trial! Instead, you opt for what seems a reasonable washout period based on related studies and on what is known about the reversibility of the physiological changes the intervention may cause. For a fully controlled crossover in certain conditions, the washout need not be perfect, because the residual effect of a treatment is measured in the next pre-test and is subtracted off the post-test measurement. The conditions are that the effect of the following treatment is not modified by the residual effect of the previous treatment, and that the period of the intervention is too brief relative to the washout period for any further appreciable washout of the previous treatment. The need for a washout means that the subjects will be in a
crossover study for a longer period than in a fully controlled trial, so
there is more likelihood that some will not be available for their subsequent
treatment and measurements. Subjects may also drop out before the
second treatment because of side effects of the first treatment or because
they are reluctant to commit to at another treatment and set of
measurements, particularly if the intervention or measurements are arduous. Such
withdrawals may introduce bias if the withdrawals are
more common for one treatment. Balancing the advantages and disadvantages, the US Food and Drug Administration once suggested that crossovers be abandoned in clinical studies (Cornfield and O’Neill, 1976). In our view, crossovers are preferable, when there are no problems with recruitment and retention of subjects. Having opted for a crossover, you then have a choice between the fully controlled and simple versions. Fully Controlled vs Simple
Crossovers
A fully controlled crossover is a better design than a simple crossover in all except one respect: a simple crossover ideally requires only one-quarter the sample size. The simple crossover is therefore an option when you are short of subjects or resources. The sample size in any pre-post design is determined by the reliability of the outcome measure over the time between tests. In the case of a fully controlled crossover, the relevant time between tests is the duration of the intervention, whereas in a simple crossover the time between tests is the duration of the washout plus the duration of the intervention. When the duration of the washout is weeks or months, the reliability is likely to deteriorate, because consistent changes will develop in the subjects that vary randomly from subject to subject. The required sample size for the simple crossover will therefore increase and may even exceed the sample size for a fully controlled crossover. The break-even point is shown in the footnote to Figure 2 and explained in Appendix 1. A simple crossover is usually preferable to a fully controlled crossover when there are more than two treatments and when each treatment washes out quickly. To reduce bias arising from the interaction of any carryover of one treatment with the next, the order of treatments needs to be randomized using a Latin square, which ensures every treatment follows every other treatment an equal number of times. The main drawback of the simple crossover is that it does not provide an estimate of individual responses. This drawback can be overcome by including an extra control treatment as if it were another experimental treatment, at the cost of the additional time and resources for an extra treatment and measurement. The two control treatments can then be analyzed as a reliability study to provide an estimate of the typical error, which is needed to assess the changes that each individual experiences with the other treatment or treatments. The assessment can be performed quantitatively using a spreadsheet for assessment of individuals. Estimation of the standard deviation representing the individual responses and its confidence limits requires mixed modeling. The spreadsheet for analysis of simple crossovers available at
this site does not allow for a systematic change in the mean of the dependent
variable that would have occurred from test to test in the absence of any
intervention. Also known as order, familiarization or learning
effects, such changes can be due to the subjects becoming more proficient
with test protocols or to external influences such as changes in
environmental conditions. If there are equal numbers in the crossover groups,
an order effect does not bias the estimate of the treatment effect, but it
reduces the precision of the estimate by effectively adding noise to the
change scores. By including the order effect
in a more sophisticated ANOVA or mixed-model analysis, you remove any bias
arising from unequal numbers in the groups, and you do not lose
precision. StatsDirect and other medical statistical packages include order
effects in their procedures for analysis of crossovers. Order effects are the most frequently debated analysis issue in the literature on crossover trials (e.g., Senn, 1994). The debate focuses on the extent to which failure to fully wash out a treatment manifests as an order effect and on strategies for dealing with it. The safest strategy is to use a simple crossover only in situations where the likelihood of carryover is negligible. Order effects are not an issue in a fully controlled parallel-groups or crossover trial, because they disappear completely from the difference or change in the change scores. Conclusion
The decision about which kind of controlled trial to use depends on the availability of subjects for a control group or treatment, the washout time for the treatments, and when resources are limited, the reliability of the outcome measure over the treatment and washout times. The weakest design is a time series, because there is no control group or treatment. A fully controlled parallel-groups trial is the industry standard. When washout time is acceptable, the benefits of assessing the effects of treatments on every subject make the best designs arguably either fully controlled crossovers or simple crossovers with an extra control treatment. References
Altman DG, Schulz KF, Moher D, Egger M, Davidoff F, Elbourne D, Gøtzsche PC, Lang L (2001). The revised CONSORT statement for reporting randomized trials: explanation and elaboration. Annals of Internal Medicine 134, 663-694 Cornfield J, O’Neill RT (1976). Minutes of the Biostatistics and Epidemiology Advisory Committee meeting of the Food and Drug Administration. June 23 Dunn G (2002). The challenge of patient choice and nonadherence to treatment in randomized controlled trials of counseling or psychotherapy. Understanding Statistics 1, 19–29 Hopkins WG (2000). Quantitative research
design. Sportscience 4, sportsci.org/jour/0001/ wghdesign.html Hopkins WG (2003). A spreadsheet for analysis
of straightforward controlled trials. Sportscience 7,
sportsci.org/jour/03/wghtrials.htm Hopkins WG (2004). How to interpret changes in an athletic performance test. Sportscience 8, 1-7 Senn S (1994). The AB/BA crossover: past, present and future. Statistical Methods in Measurement Research 3, 303-324 Published Dec 2005 Appendix 1: Sample Size for Crossovers
• This analysis does not take into account the reduction in sample size that occurs when the pretest in a controlled trial or pre-post crossover or the control treatment in a crossover is included as a covariate. In all cases, the usual error variance is reduced by a factor 1–e2/(2SD2), where SD is the observed between-subject SD and e is the typical (standard) error of measurement. When SD >> e (a highly reliable measure) there is no reduction, but at the other extreme, SD = e (a very unreliable measure, with intraclass or retest correlation = 0), the error variance and therefore the sample size is reduced by up to one half, depending on the values of the t statistics in the remaining formulae. This adjustment is now included in the sample-size spreadsheet. • Let n be the number of subjects. • As above, let sd the typical error over the time frame of the intervention. • And let e be the typical error over the time frame of the washout plus intervention. Assume additional error due to individual responses can be neglected. • Then the standard error of the change in the change in the means in the fully controlled crossover is 2sd/√n. • And the standard error of the change in the means in the simple crossover is √2e/√n. • For the same number of subjects, the simple crossover gives better precision than the fully controlled crossover when √2e/√n<2sd/√n, i.e. when e<√2sd, i.e. when the typical error over the washout+intervention period is less than 1.4x the typical error over the intervention period only. • For the same number of tests, sample size in the fully controlled crossover is half that of the simple crossover, so the simple crossover gives better precision than the fully controlled crossover when √2e/√n<2sd/√(n/2), i.e. when e<2sd, i.e. when the typical error over the washout+intervention period is less than twice the typical error over the intervention period only. • The comparison of the ICCs for the fully controlled vs simple crossover depends on the magnitude of the between-subject SD. If SD=√20sd=~4.5sd, the short-term (intervention period) ICC is 0.95, and the simple crossover will give better precision for the same number of subjects if its ICC is >0.90. For the same number of tests, the simple crossover will give better precision if its ICC is >0.80. • The sample size for a fully controlled crossover, is 4(1.652)(sd/d)2, or ~11(sd/d)2, where d is the smallest worthwhile effect. • For a simple crossover, the sample size is ~2(1.652)(e/d)2, or ~5.5(e/d)2. |