|
A New View of Statistics | |
![]() ON
THE FLY FOR CORRELATIONS
ON
THE FLY FOR CORRELATIONS
As I've explained already on the previous page, to do the research on the fly, you keep sampling until the confidence interval for the correlation falls below 0.20. Here's how to go about it.
|
|
|
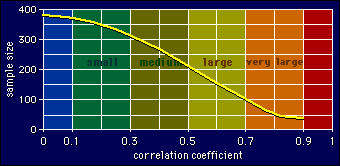
Here's an example. You want to find the correlation between height and weight in a population. You think it will be very large, so you start with 45 subjects. You get a correlation of 0.71. The graph shows the corresponding sample size is about 95. So sample another 50 subjects (= 95 - 45), then calculate the correlation for all 95. You get 0.67, which means about 120 subjects. Off you go, test another 25. This time the correlation for all 120 subjects is 0.69. Stop. Publish.
The chance that you will finish on each round after the initial
one is 50% or less, so the chance of having to go more than three
extra rounds is about 10% or less. By then, my simulations show that
typically you're adding only 5% to the total number of subjects, so
you'll converge rapidly on the final correlation.
Confidence Limits for the
Correlation
Naturally, you're expected to give the confidence limits of
the correlation coefficient you end up with. If your stats program
doesn't generate them, you'll have to use the
Fisher z transformation:
z = 0.5log[(1 + r)/(1 - r)]. The
transformed correlation (z) is normally distributed with variance
1/(n - 3), so the 95% confidence limits are given by
z ± 1.96/sqrt(n - 3). You then have to
back-transform these limits to correlation coefficients using the
equation r = [(e2z -
1)/(e2z + 1)]. This is
standard stuff for statisticians, but as a mere mortal you'll be
struggling. I've set it up on the
spreadsheet for confidence
limits.
![]() More
on the Initial and Final Sample Sizes
More
on the Initial and Final Sample Sizes
But there's an acceptable cheat's way around this problem that allows you to start with 45 every time. All you do is set an upper limit on the number of subjects you will test, then take the limit off. For example, start with 45 subjects, but if the next round requires 250 more, you test only 100. Then you work out how many more you need from the total of 145, and test them.
However you do it, you'll get there in the end. And the answer
will be trustworthy: I've found that the greatest bias occurs for
correlations around 0.7-0.8, but it is only 0.01. This amount of
bias--5% of the confidence interval--is negligible. What's more, the
bias is insensitive to the initial sample size, and there is no
noticeable extra bias when you set reasonable limits to the sample
size on each extra round of sampling (e.g. 100 on the first round,
200 on the second and/or higher rounds). So even if you haven't got
the resources to go to the full 400 subjects, you can still get a
practically unbiased estimate of the correlation, albeit with a
less-than-ideal confidence interval for the smallest
correlations.
![]() Adjusting for Imperfect Validity
Adjusting for Imperfect Validity
Here's an example. Suppose the validity correlations are 0.90 and
0.80. Overall that's 0.72, and 0.722 is 0.52. So start with 45/0.52 or 87
subjects. Suppose you get a correlation of 0.35. For perfect validity
that would be a correlation of 0.35/0.72 or 0.49. On the graph that's
equivalent to 220 subjects, but that's for perfect validity, so you
need 220/0.52 or 423 subjects. So test
423 - 87 = 336 subjects. And so on.
Mind-boggling, I'm afraid. It's all much simpler if you use the
spreadsheet!
![]() Nearly Perfect Correlations
Nearly Perfect Correlations
Meanwhile, start with a sample of about 15 and see what you get for the correlation and for its confidence limits. You'll almost certainly find that the lower confidence limit is too low, unless you're lucky enough to get a correlation of 0.98 or 0.99. So you'll need more subjects. Estimate the sample size for the next round using the rule that the width of the interval is approximately inversely proportional to the square root of the sample size. Then test the extra subjects, recalculate the correlation and its confidence limits, and go to another round if necessary.
For example, let's suppose you get a correlation of 0.91 with 15 subjects. The 95% confidence limits are 0.97 and 0.75. Well, if the correlation is really 0.97, that's great for every possible purpose. But 0.75 is hopeless for applications requiring an almost perfect correlation! Obviously you need to narrow down the confidence interval. Halving the interval would help, which means a total of 4x as many subjects, or another 45. Test them, add them to the original 15, then recalculate. Suppose you get 0.93. The 95% confidence limits are now 0.96 and 0.89. Whether you stop at this point or go to another round of testing depends on whether 0.89 makes a big difference compared with 0.96, for the application you have in mind. I'd stop there if I was defining the validity of a variable for the purpose of seeing how many extra subjects I might need in a big cross-sectional study. I'd want to narrow down the interval a bit more if I wanted to use the underlying linear relationship to predict things like body fat from skinfold thickness. And I'd probably want to narrow it down more if the correlation was a reliability I was using to predict a sample size in a longitudinal study, using the old-fashioned approach.
For another example, imagine that you got a correlation of 0.98
with your initial sample of 15. The confidence limits are 0.96 and
0.99. No need to test any more subjects!
Go to: Next · Previous · Contents · Search
· Home
resources=AT=sportsci.org · webmaster=AT=sportsci.org · Sportsci Homepage · Copyright
©1997
Last updated 27 May 97